
Overview
MTN Shop is a leading online storefront for one of Nigeria's most prominent telecommunications providers. In this review, we delve deep into the website's performance, usability, and overall user experience. Our aim is to identify potential bottlenecks, areas of improvement, and provide actionable insights that can elevate the site's efficiency and user satisfaction. Join us as we uncover the strengths and areas of opportunity for shop.mtn.ng.
Tools Used
Calibre, Lighthouse, WebPageTest, Google Pagespeed Insights, and Chrome DevTools.
Methodology
For this audit, we mainly used a synthetic testing to evaluate the site's performance across different devices and network conditions. The closest we got to Real User Metrics was Chrome Dev Tools.
Time Period
The audit was conducted on the 9th of October, 2023.
Performance Summary
Desktop
Cumulative Layout Shift (CLS)
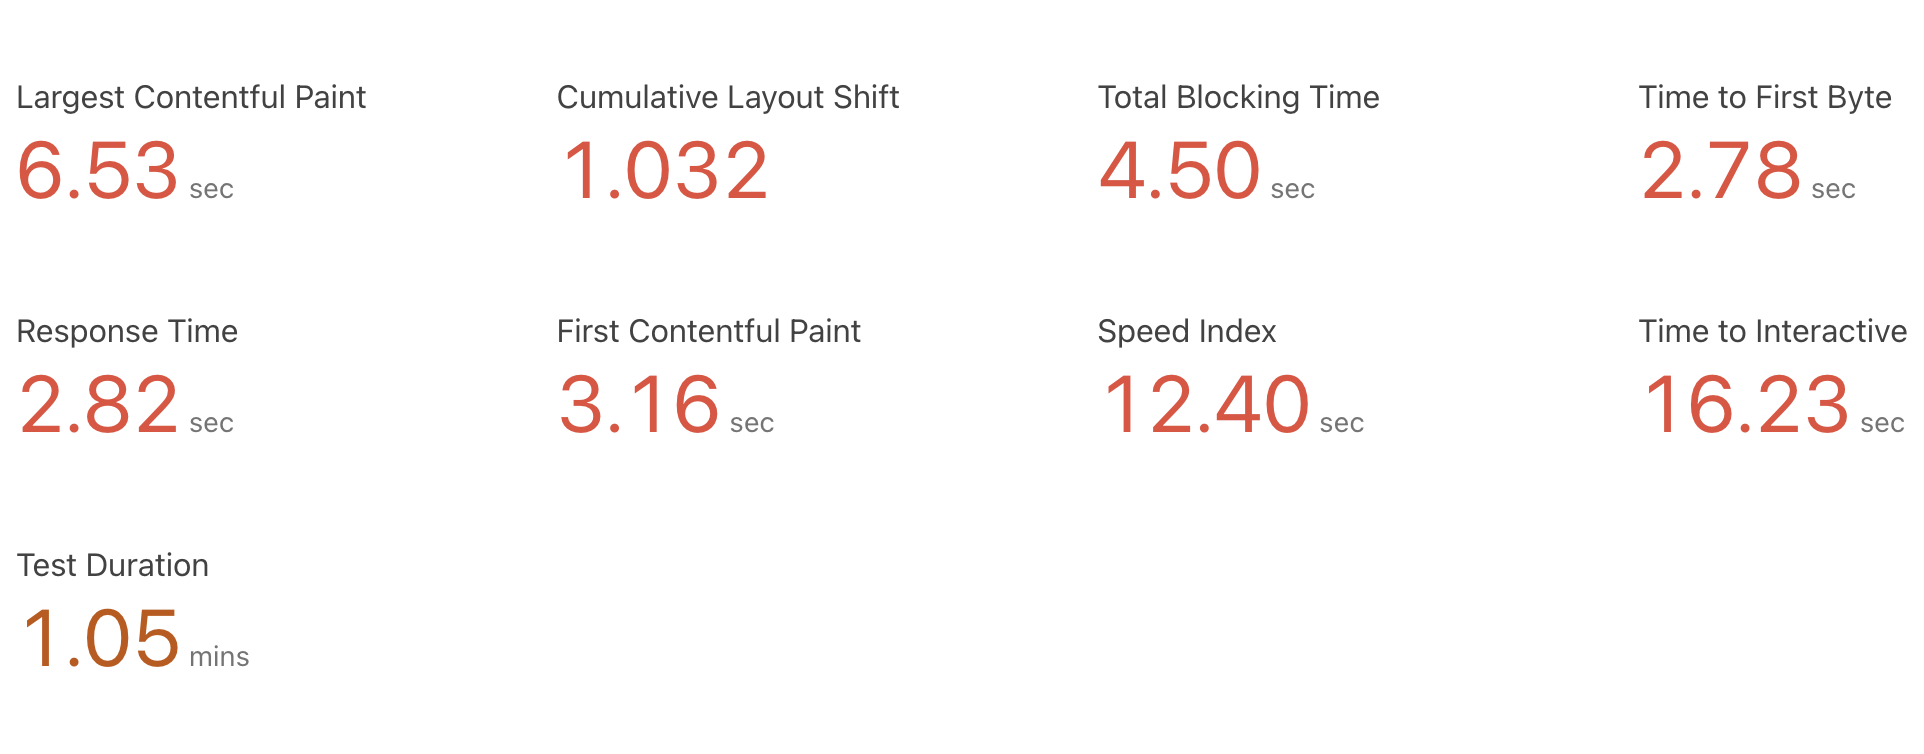
Using Calibre, we found that the site's CLS score for the Homepage was above 1. This means that the site's layout is shifting a lot, which can be very frustrating for users. For CLS to be considered "good", it should be less than 0.1. Meaning less than 10% of the page's content should be shifting around.
Opportunity
From throttling the network to Slow 4G, we were able to spot the culprits behind the high CLS score. The first culprit is the nav bar.
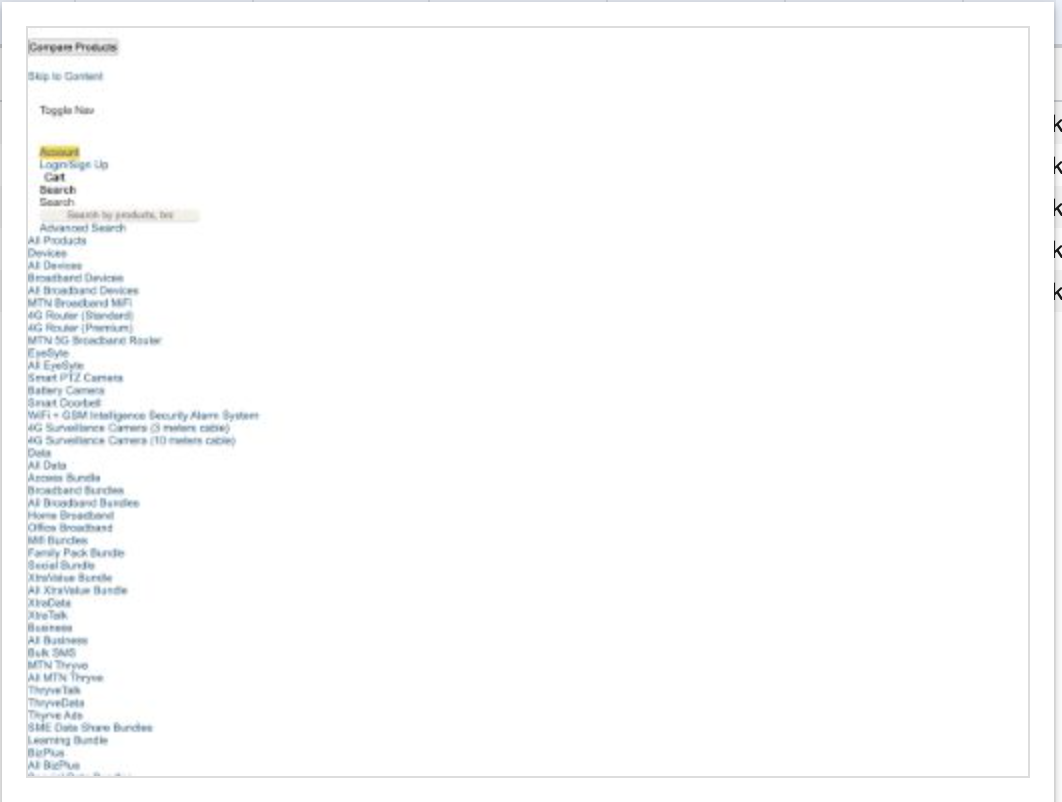
After noticing this, we decided to take a look at the < head > tag on the homepage. Taking a look at what gets to the browser, here is what we noticed:
There were several fonts, several scripts above the "Critical CSS." The criticalCSS method is a tricky method. For this to work, different viewports need to be accounted for.
Possible Solutions
A possible solution to get the CLS early on is to use the preload method.
< link rel='preload' href='path_to_critical_css.css' as='style' >The link rel='preload' method is a way to tell the browser to load the CSS file as soon as possible. This should help with the CLS, providing the stylesheet before the browser gets to render the navigation bar.
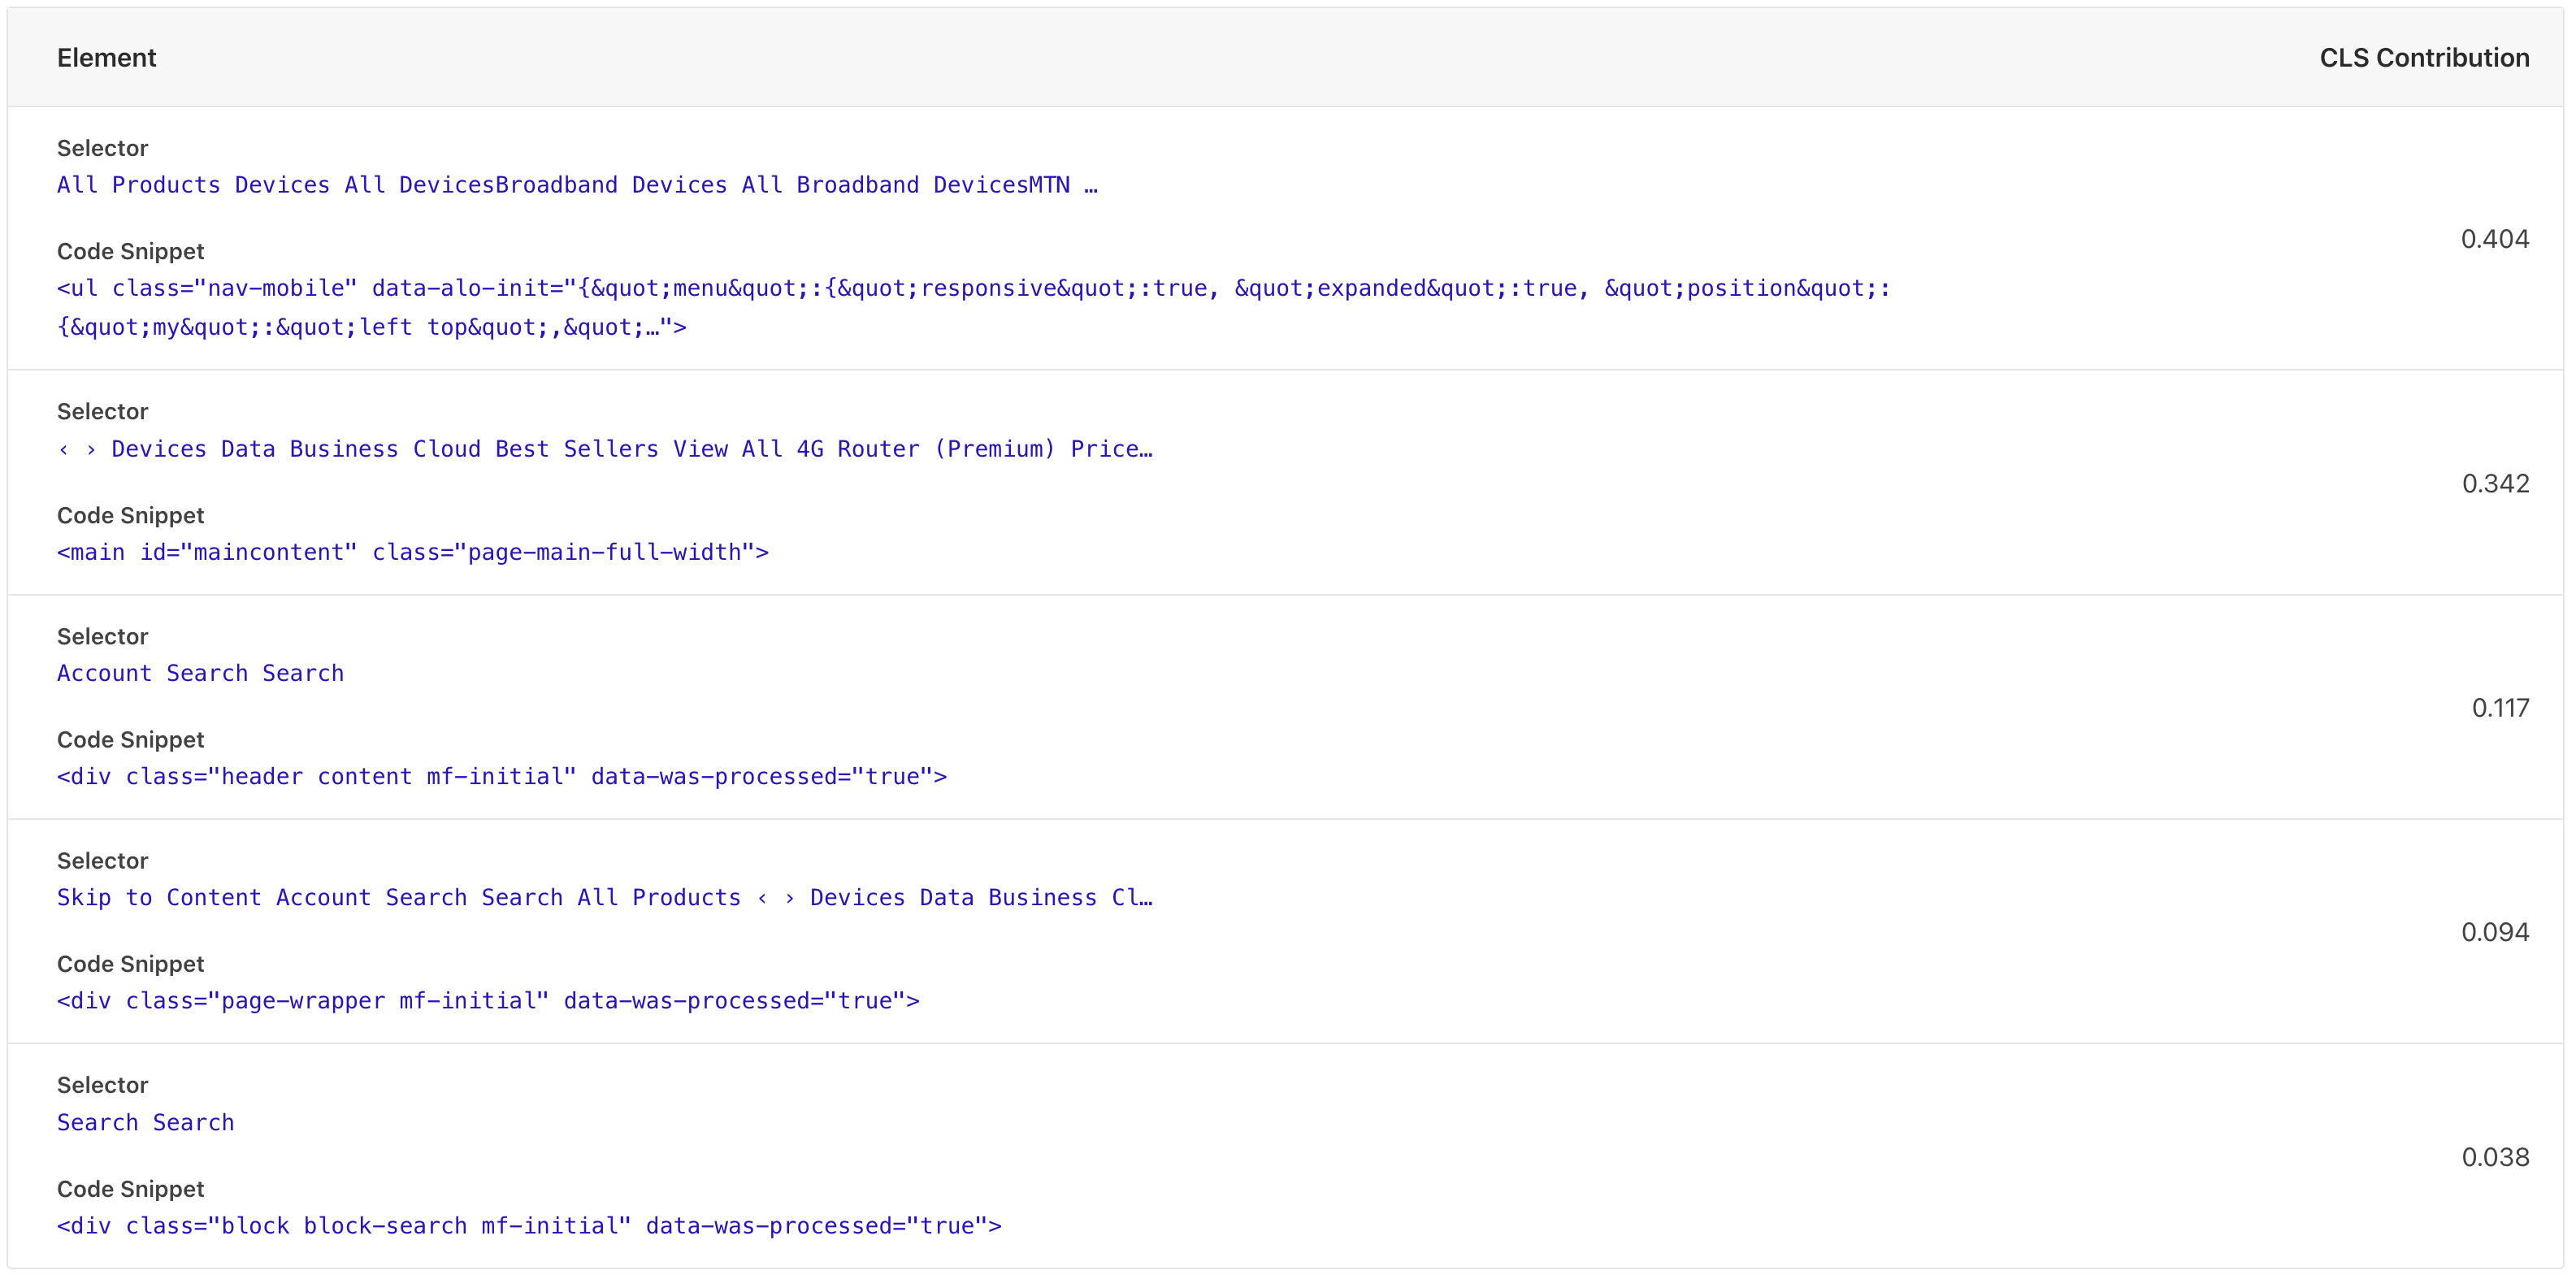 Above are the screenshots of the causes of Layout Shifts on the homepage.
Largest Contentful Paint (LCP)
On a DSL network, the LCP was recorded at 6.53 seconds. For a good LCP, it should be less than 2.5 seconds. and for a good First Contentful Paint (FCP), it should be less than 1.8 seconds.
Because these two related metrics are so high, we decided to take a look at the network tab in Chrome Dev Tools and also the waterfall chart in WebPageTest as well as the < head > tag to determine what could be slowing things down.
Opportunity
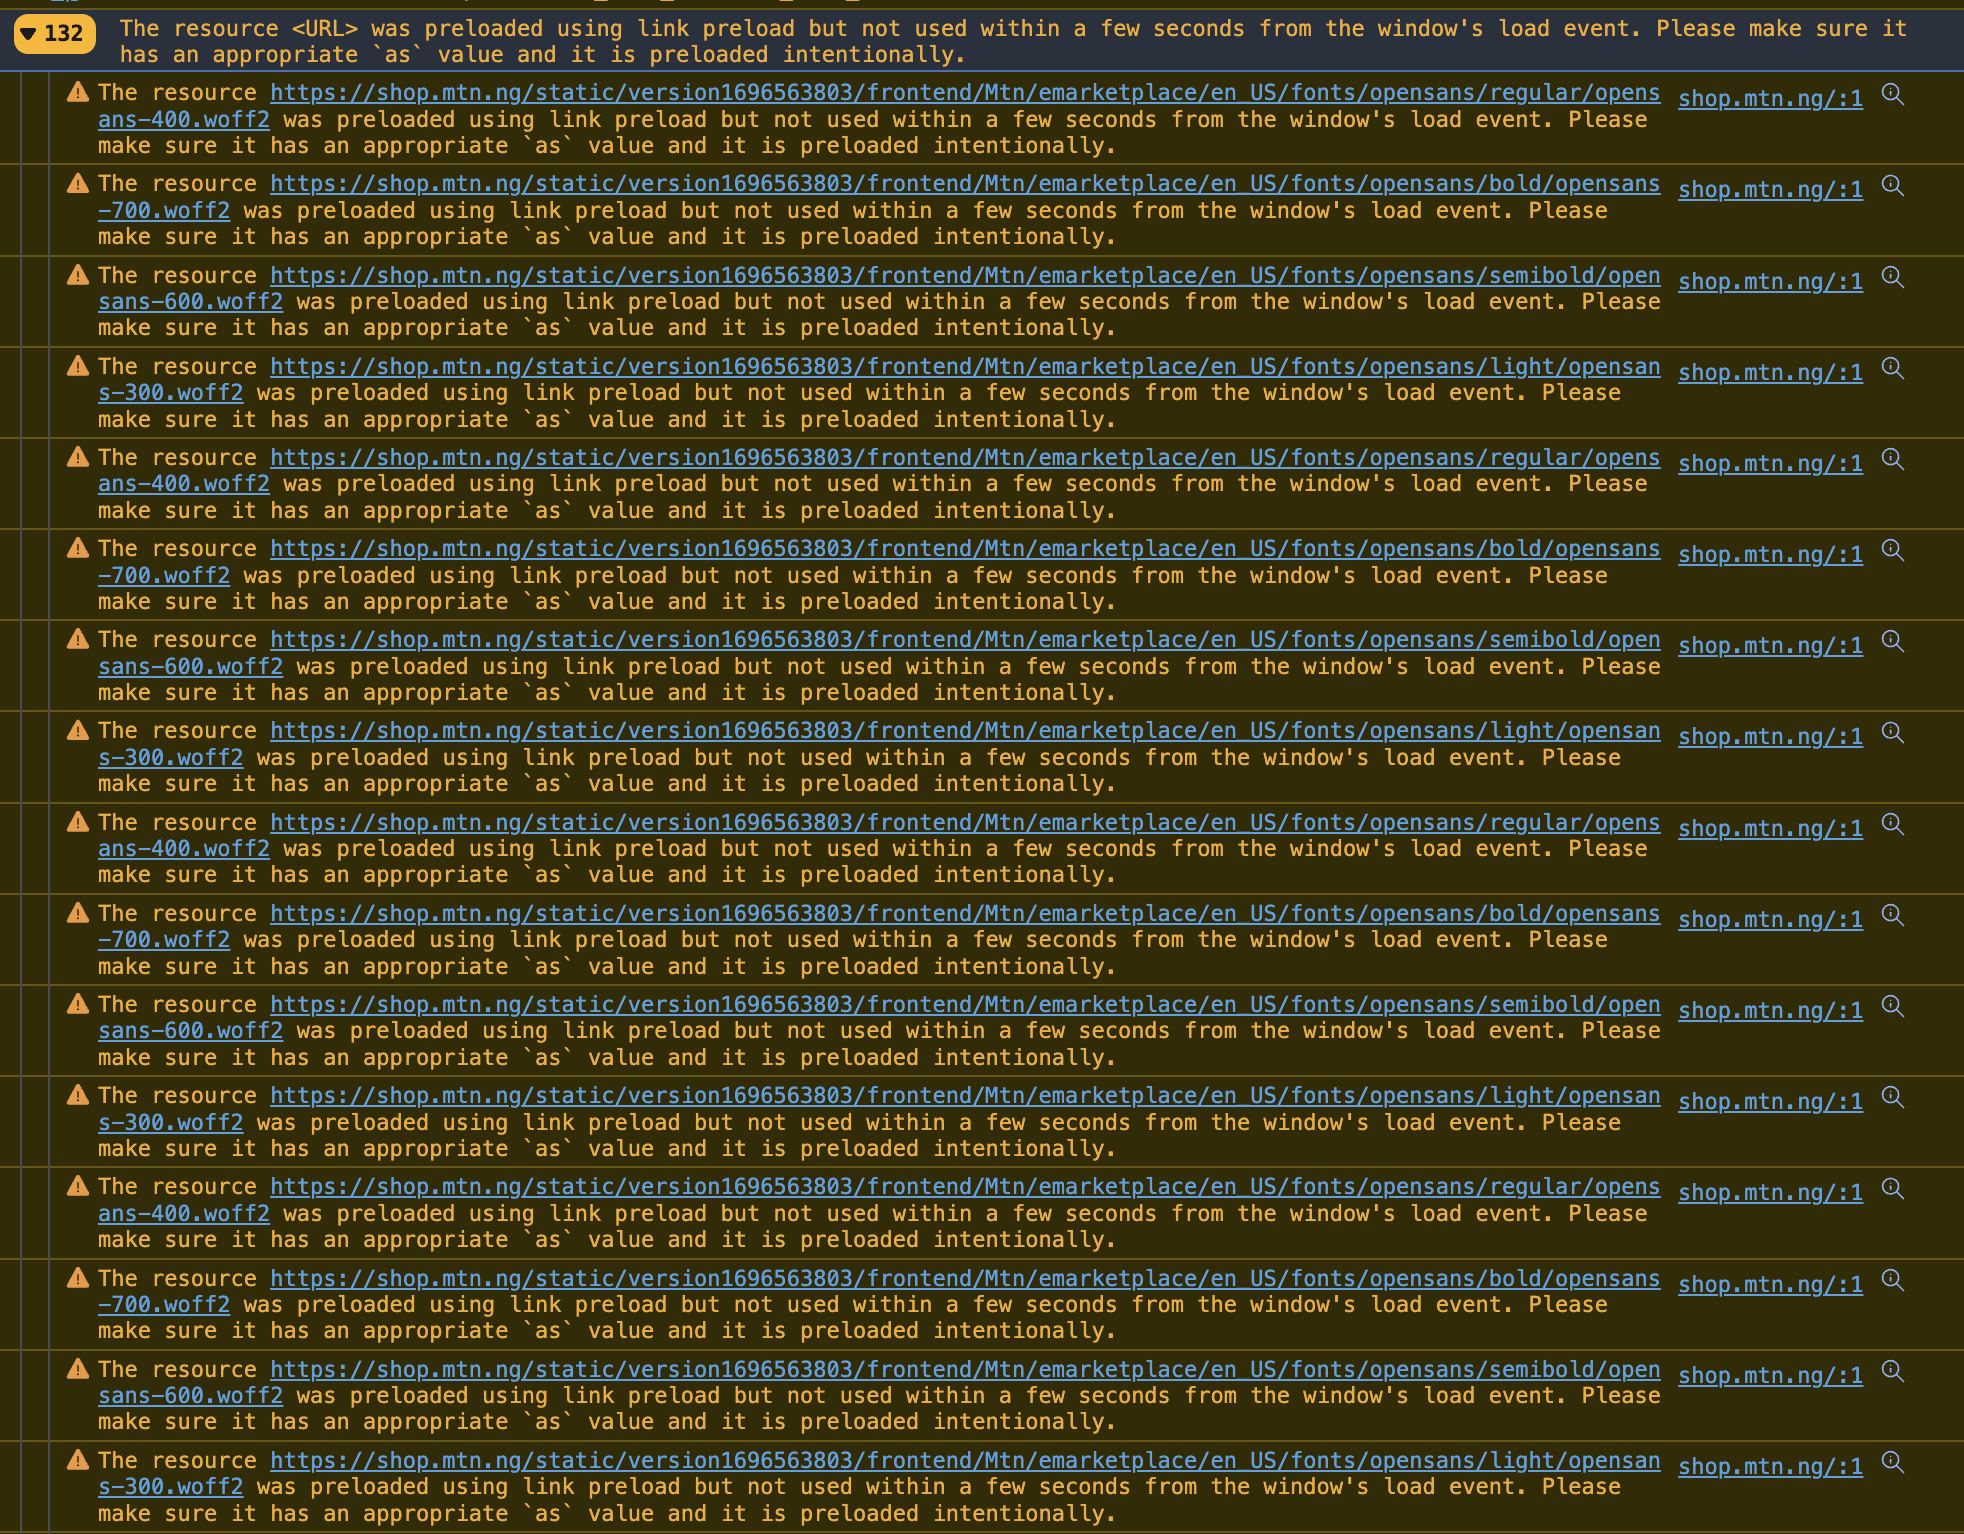
While taking a look at the screenshots in the network tab, we noticed that the loader-1.gif was being displayed longer than it should with the actual desktop hidden behind it. We also noticed several fonts, several scripts are preloaded and executed before the critical assets on the page can be rendered.
Possible Solutions
Resolving the CLS issue should help with the LCP and FCP. In addition to that < head > tag should be cleaned up, as it is quite huge and not arranged in order. Making use of capo.js can help in understanding what the order of the < head > tag should be.

Total Blocking Time (TBT)
The Main Thread was found to be blocked for 4.50 secs. This is a very high TBT. For TBT to be considered 'good' it should be less than 300ms. The Total Blocking Time (TBT) is the amount of time the page is blocked from responding to user input.
Opportunity
Third Party tools and services were found to have a total execution time of 2.56sec. Investigating tools and services that take over 150ms to execute is a good place to start. We also saw two instances of Google Tag Manager being executed.
Possible Solutions
The first thing to do is to investigate the tools and services that are taking over 150ms to execute. Focusing on reducing long tasks and reducing the amount of JavaScript on the page should help with the TBT. Take a look at the screenshot below for more details.
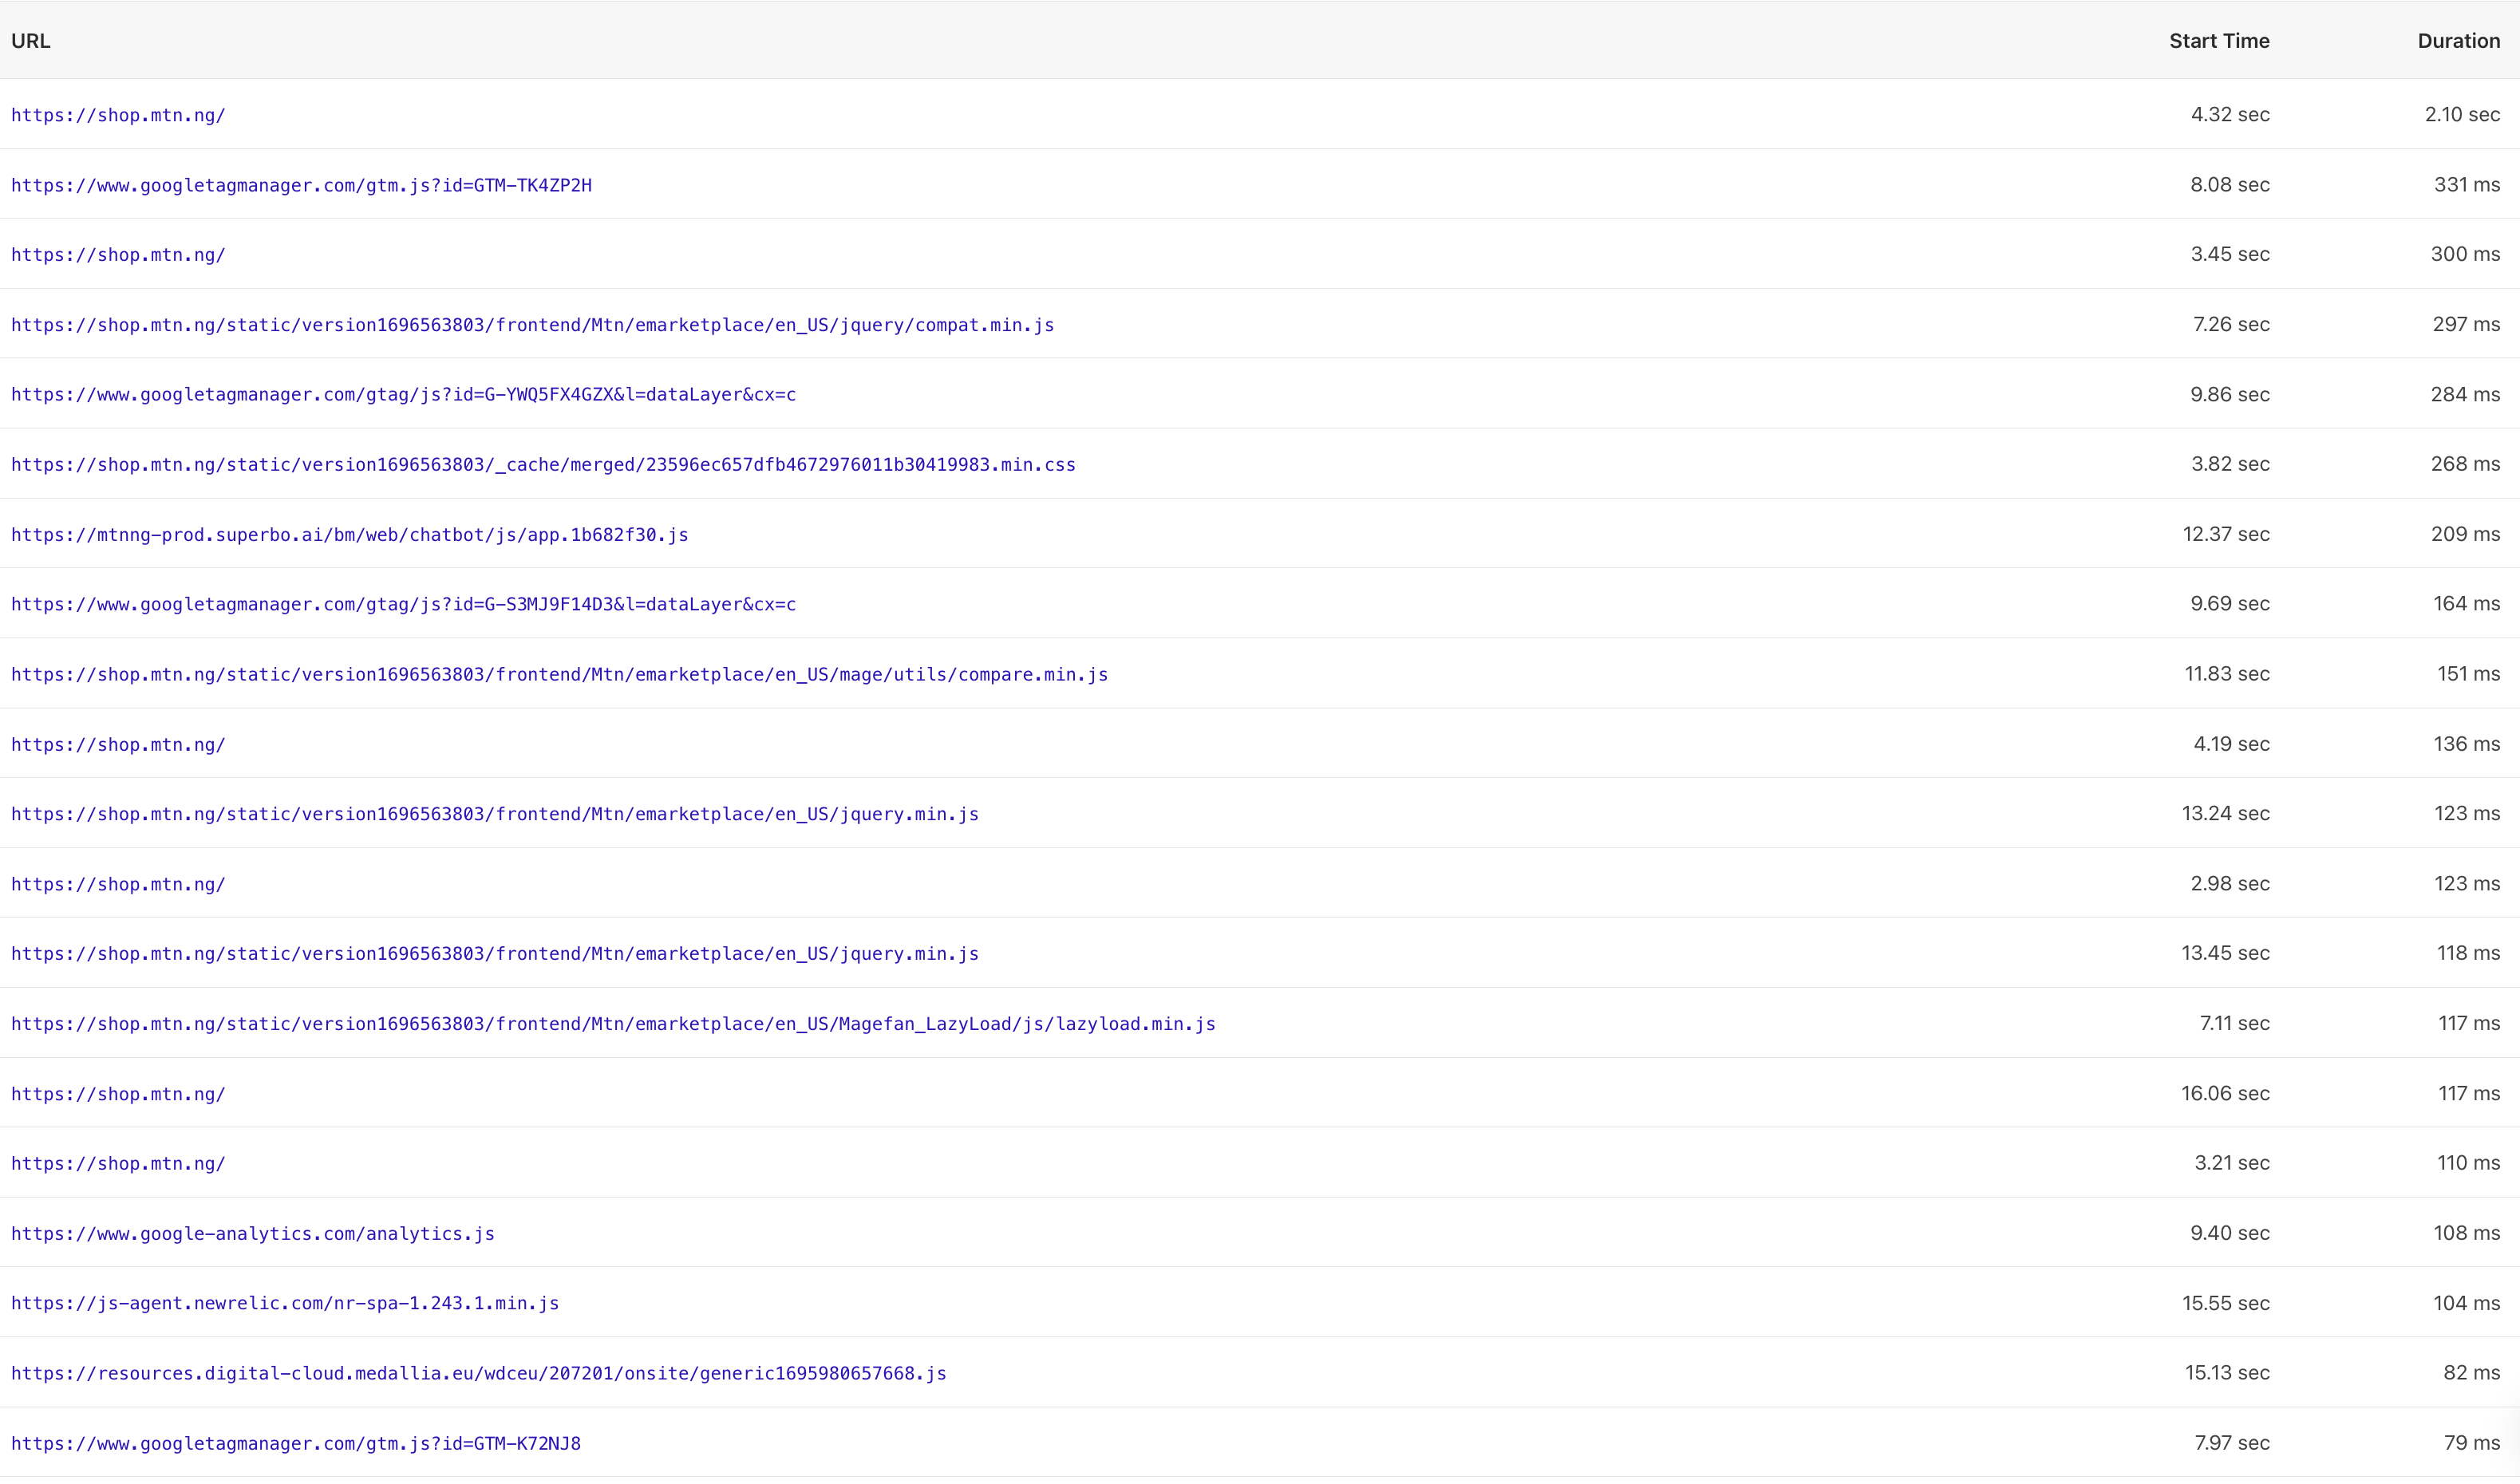
The second thing to do is to limit the number of Tag Managers to one.